The City of Hamilton in Ontario was the second city in Canada to establish a municipal water system, making it one of the oldest and most complex water distribution systems in the country. To ensure safe drinking water, the city monitors for microbiological water quality and chlorine residual by collecting drinking water samples from a variety of sources including, sampling stations, sample taps within pumping stations and fire stations, and taps within institutional and commercial buildings. When the COVID-19 pandemic hit in March of 2020, the City realized the vulnerability of its sampling program in a matter of days as closures limited access to many sampling locations within buildings.
Shane McCauley, director of Water and Wastewater Operations for Hamilton Water, said, “Being an older city, our sampling program, while meeting or exceeding regulatory requirements, was built in pieces as the city grew over time, so we had a multi-layered approach. With the shutting down of facilities during the pandemic, we had to face the limitations of our sampling program overnight.”
The shutdown of several public and commercial services meant that Hamilton had to find alternate locations for drinking water sampling. It did this by increasing the use of sampling stations at a number of outside facilities like parks and city-owned water facilities, including fill stations, reservoirs, and both water and sewage pumping stations. Many sampling locations were retired, and others were assigned to be temporarily inactive during this period.
Hamilton Water is known for jumping into action when a vulnerability arises and chose to approach the problem as an opportunity to modernize the sampling program for microbiological water quality and chlorine residual. “What we needed was a complete review of the entire City’s sampling program and a plan to prioritize needs that not only arose from the pandemic shutdowns, but that would also provide a long-term resilient sampling program covering the entire city and providing samples that represent the whole water distribution system,” said McCauley. The City hired Jacobs, an engineering consulting firm, to review the existing distribution sampling program and make recommendations based on best practices.
Designing a sampling system to collect the best samples
Sampling stations are the preferred way to collect microbiological samples as they provide a direct connection to water within the watermain resulting in more consistent test results and a direct representation of the water quality in the water distribution system. One of the problems with taking samples within buildings is that water can remain stagnant in the plumbing for long periods of time, resulting in chlorine residual loss and the development of biofilms.
“Building samples are more likely to produce false positives due to sample tap contamination, biofilms within the building plumbing, and cross connection from a sprinkler system or fire system,” said McCauley. “When we get a sample exceedance, we need to go back for additional samples until we meet the requirement. Each time this happens, we have to endure the cost of rolling a truck with a field crew. The challenge is that the majority of these sample exceedances are not related to the quality of the water in the distribution system.”
Similarly, sampling stations are also preferred for chlorine residual monitoring, as they are a direct measure of chlorine residual in the distribution system, as opposed to water that has travelled through plumbing of a building.
Hydrants are not recommended for microbiological or chlorine residual sampling because it is very difficult to collect representative samples. By design and infrequent usage, hydrants are prone to the build up of sediment and bacterial growth. Also, flushing hydrants at high flow prior to sample collection can scour the watermain and dislodge biofilm and other deposits.
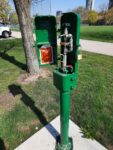
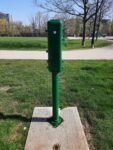
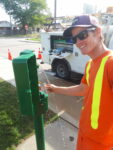
In 2020, the City installed 12 Eclipse sampling stations that are designed for extreme cold climates which are not uncommon in Hamilton. Crews drain the water with a pump after the sample has been taken and the unit has been shut off. This is especially important in the winter to prevent freezing. The entire station can be removed from the ground and thawed in the event of a freezing issue. The units are also tamper-proof to prevent contamination.
To ensure a sample represents water quality from the watermain and not the service line, it is important to flush sample stations for the right duration prior to sample collection. Flushing for too long, on the other hand, may result in the sample representing water from another part of the distribution system. Hamilton created an Excel-based calculator to allow field staff to determine an appropriate pre-sampling flushing duration for each sampling station. Based on the Hazen-Williams Equation, the calculator estimates a minimum flushing duration based on the flow rate at an assumed pressure and the following inputs:
- Service line characteristics (diameter, Hazen-Williams C Factor, length)
- Static pressure in the distribution system near the sampling station
- Sampling station characteristics (diameter, Hazen-Williams C Factor, length, flush tap opening)
Choosing the right locations for sampling stations
The location of a sampling site can affect the quality of the sample and it’s important to ensure the entire distribution system is adequately monitored. Using a variety of data sources including GIS, the City’s hydraulic model, pressure district data, satellite imagery, and field visits, the City identified optimal locations for new stations based on the following criteria:
Population density – A greater number of samples is typically collected in areas with higher population density (city centers and urban areas with high-rise dwellings). Adequate sampling must also occur in areas with moderate population density (suburban areas) and low population density (rural areas).
Geographic extent of pressure district – Sites were chosen to represent the full extent of the distribution system, (including areas of high, medium, and low population density), to confirm that the system’s disinfectant residuals are adequate at the farthest extremities.
Water age – Using the City’s hydraulic model, new sites were selected based on water age characteristics in each pressure district under average daily demands. Sites were selected to represent areas of both high water age and low water age.
Critical services – Some sampling sites were selected for proximity to facilities with populations categorized as sensitive, such as schools, and hospitals.
Land available – Lands owned by the City, such as parks, right-of-ways, and boulevards were targeted for sampling locations as they are less disruptive to residents versus privately owned sites.
Accessibility – Ease of access and safety of operators during sample collection was considered. Sites such as roads with high traffic, high speed, or lack of parking were avoided.
Flow and demand – Sampling sites were selected in areas with higher flow and in areas with lower flow. Sites located on higher flow mains allow the City to track changes in water quality as water flows through the distribution system. In contrast, sites on lower flow mains can provide information on the impact of water stagnation on water quality degradation.
Looped watermains – Sampling locations were selected on looped watermains and avoided areas of excessive stagnation, such as dead-end watermains.
Pipe materials – Sites were selected with a range of watermain materials (PVC, cast iron, ductile iron, asbestos cement, etc.) to capture the effects on water quality due to the nature and condition of the pipe, as certain pipe materials are more susceptible to corrosion or scale build-up.
Locations of significant infrastructure – Sampling location selection also considered significant distribution infrastructure such as reservoirs and elevated tanks, as a higher potential exists for deteriorated water quality near storage facilities depending on their volume and flow conditions.
Doubling up on other sampling and programs – Orthophosphate sampling is being expanded in the City’s lead zone. New sampling station locations for microbiological monitoring added in this zone will create efficiencies in the corrosion control monitoring program. Selected locations also considered where alternative water quality data collection is planned to occur as part of the City’s interim nitrification program.
Number of Sampling Sites and Frequency of sampling
There are many considerations when determining sample frequency, such as source water quality, number of raw water sources, size and complexity of the distribution system, method of disinfection, etc. Most water systems in North America use one of the following three strategies to define the number of sampling locations and sampling frequency to meet regulatory requirements for microbiological and chlorine residual monitoring:
Strategy 1 – The number of sampling sites is equal to the number of monthly regulatory samples required.
Strategy 2 – The number of sampling sites is two to three times the number of monthly regulatory samples required.
Strategy 3 – The number of sampling sites is half the number of monthly regulatory samples required.
The distribution system’s population classification (and therefore the number of regulatory samples required) affects which sampling strategy is used. The City’s six drinking water systems fall under the large or small municipal residential classification as seen in the table below.
Summary of Hamilton drinking water systems and associated classifications
| City of Hamilton Water System | Service Population (2022) | Classification per O.Reg 170/03 |
| Woodward Avenue Subsystem | 555,000 | Large Municipal Residential |
| Fifty Road Subsystem | 170 | Small Municipal Residential |
| Lynden (Groundwater System) | 270 | Large Municipal Residential |
| Carlisle (Groundwater System) | 1,530 | Large Municipal Residential |
| Freelton (Groundwater System) | 680 | Large Municipal Residential |
| Greensville (Groundwater System) | 95 | Small Municipal Residential |
Based on the above classification, the frequency requirement for microbial sampling is determined by Schedule 10 (large municipal residential systems) and Schedule 11 (small municipal residential systems) of Ontario Regulation 170/03 under the Safe Drinking Water Act, 2002.
Microbiological sampling frequency requirements per O.Reg 170/03 Schedules 10, 11
| Drinking Water System Classification | Applicable Schedule | Population Served | Number of Distribution Samples Per Month |
| Large Municipal Residential | Schedule 10 | <=100,000 | At least 8 samples, plus 1 additional sample for every 1,000 people served. At least 1 sample taken each week |
| >=100,000 | At least 100 samples, plus 1 additional sample for every 10,000 people served. At least 3 sample taken each week | ||
| Small Municipal Residential | Schedule 11 | NA | At least one distribution sample taken every two weeks (if the system provides treatment equipment in accordance with Schedule 1 or 2 and the equipment is operated in accordance with that Schedule). At least one distribution sample taken every week if the system does not provide treatment |
A closer look into the Woodward Avenue Subsystem
With 22 pressure districts, the Woodward Avenue Subsystem is quite complex and is the largest water distribution system in Hamilton. Historically, it used a wide variety of types of sampling locations as shown in Figures 2 and 3. Regulatory requirements stipulate 156 samples per month. Pre-pandemic it used a hybrid of Strategies 1 and 3 for the number of sampling sites and moved closer to Strategy 3 during the pandemic:
- From 2016 to 2020 (pre-pandemic), the City listed around 100 active sampling locations and collected samples from 85-95 locations. Sampling frequency per location varied significantly, with some locations sampled multiple times per month while others were sampled only once every other month. This is because multiple samples were required more often due to false positives from samples taken within buildings. During this period, only 5-8 samples (6%) of the 85-95 sampling locations, were sampling stations – the other 94 % were from a variety of sources such as sample taps within pumping stations, fire stations, and buildings.
- In 2021, the City collected samples from only 45 locations due to limited access to buildings during the pandemic.
- The City installed several new sampling stations during the pandemic, and sampling stations accounted for 19% of all sampling locations in active use in 2020 and 2021. In the first six months of 2022, the City collected samples from a total of 50 sampling locations, of which 42% of these locations were sampling stations.
Figure 2 below provides a summary of the types of locations in which the City collected microbiological and chlorine residual distribution samples from January 2016 to June 2022.
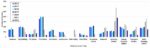
Figure 3 below provides a summary of the percent of samples collected per sampling location type for three different time periods.
2016-2019

2020 -2021

Jan-June 2022

To provide a more consistent and frequent sampling history, the City is moving toward Strategy 3 which will also reduce the number of sites to maintain. In order to align with this strategy, the City now has a total of 78 sampling locations that provide more accurate results and are sampled twice per month.
By the end of 2023, the city will not be collecting samples from businesses, recreation centers, institutional facilities, or park facilities, unless there is an emergency.
Number of samples per pressure district
The City considered population size, water demand, and total length of watermains in determining the number of sample locations in each pressure district. A total of 45 existing sampling sites were kept in the Woodward Avenue Subsystem, and a total of 37 new sampling stations were added to this sampling network. This provides for a total of 82 sampling locations, which exceeds requirements if samples were taken twice per month at each location. Below is the breakdown for the number of locations in each pressure district in the Woodward Avenue Subsystem.
Sampling requirements for the Woodward Avenue Subsystem
A small number of pressure districts (PDs 13, 14, 15, 17, and 21) only require one sampling location. For each of these pressure districts, a backup sampling site is available to allow the City to continue sampling if a location is unavailable (maintenance or repair). A minimum of one sampling site was identified in each of PDs 19 and 20. Given that both these pressure districts are very small in size and share a border, the sampling station in each of these pressure districts serves as the backup sampling location for the other.
| Pressure District |
Watermain Length % of Total |
Water Demand % of Total |
Population % of Total |
Revised Network Proposed # of Locations |
| 1 | 28.0% | 40.4% | 27.6% | 13 |
| 2 | 8.1% | 12.5% | 11.7% | 6 |
| 3 | 1.2% | 1.2% | 1.7% | 2 |
| 4 | 5.6% | 4.9% | 6.7% | 4 |
| 5 | 13.9% | 9.5% | 12.8% | 9 |
| 6 | 18.4% | 16.5% | 18.5% | 12 |
| 7 | 3.1% | 1.8% | 3.1% | 2 |
| 11 | 3.1% | 2.0% | 2.5% | 4 |
| 12 | 1.1% | 0.8% | 1.0% | 3 |
| 13 | 0.3% | 0.1% | 0.1% | 1 |
| 14 | 0.2% | 0.1% | 0.1% | 1 |
| 15 | 0.1% | 0.0% | 0.0% | 1 |
| 16 | 3.6% | 2.8% | 2.5% | 4 |
| 17 | 0.1% | 0.3% | 0.5% | 1 |
| 18 | 7.6% | 4.8% | 5.4% | 6 |
| 19 | 0.4% | 0.2% | 0.0% | 1 |
| 20 | 0.3% | 0.0% | 0.0% | 1 |
| 21 | 0.1% | 0.0% | 0.1% | 1 |
| 22 | 0.7% | 0.4% | 0.5% | 2 |
| 23 | 1.5% | 0.7% | 1.7% | 4 |
| 24 | 1.3% | 0.4% | 1.5% | 2 |
| 25 | 1.2% | 0.6% | 1.1% | 2 |
The cost for a new sampling station is roughly $7,000, including time spent on installation by personnel. To date, the City has installed 47 new sampling stations at a cost of $329,000. With regular maintenance, the life expectancy of these stations is 50 years. “Water quality is a priority item in our budget. Our residents can be confident that we work hard to provide excellent quality drinking water – it is our number one goal,” said McCauley.
Continuing on a path of improvement
As the new program has led to an increase in the number of sampling stations (and a reduction in sample sites in buildings) it has also reduced water loss. Because sampling stations are directly connected to the service line, the time required to flush is typically shorter than the time required to flush faucets located within buildings (which are usually at a greater distance from the watermain). System-wide sample collection from sampling stations can also be completed more efficiently, reducing personnel time and removing the accessibility constraints associated with taking water samples inside buildings.
“We now have an enhanced drinking water sampling program that can provide insight into the range of water quality conditions within the distribution system and can reveal changes occurring to those conditions. It can also provide warning of developing water quality problems and help identify the causes of water quality deterioration,” concluded McCauley.
The new sampling program is expected to increase distribution system sample representativeness, improve the consistency of sampling frequency, and provide more valuable information to identify and correct water quality problems.
Dave Alberton is the manager of Water Distribution & Wastewater Collection for Hamilton Water.
Janice Takahshi is the project manager of Water Distribution for Hamilton Water.