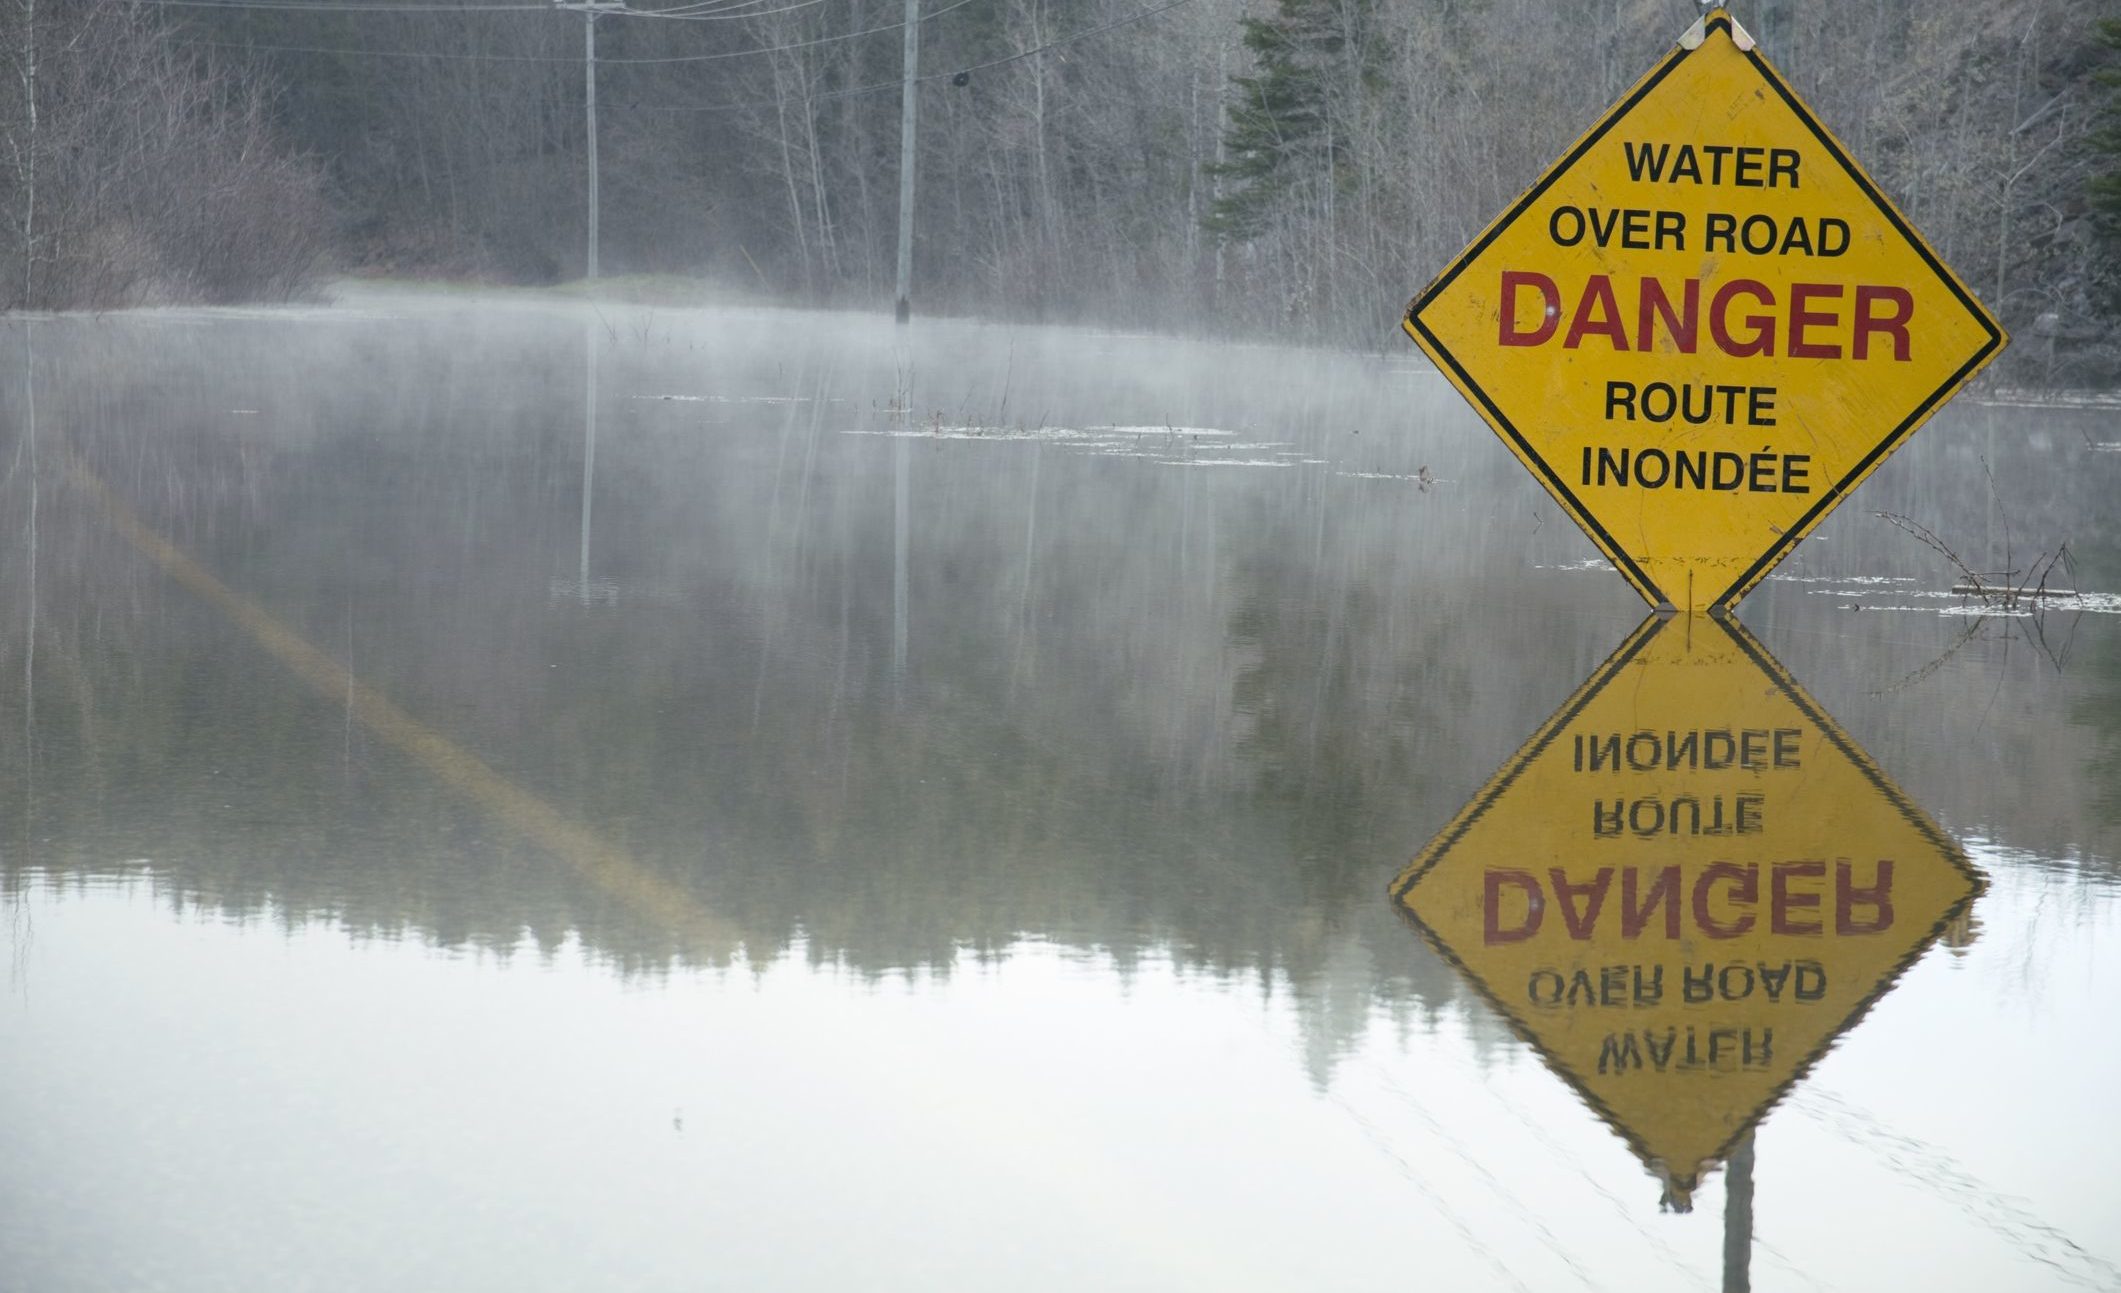
New Brunswick’s Department of Environment and Local Government has used the latest available technology to create a flood map for 2018. That year, the worst recorded flood occurred in the lower Saint John River basin.
The 2018 flood map was completed by dividing the entire Saint John River into 83 sections and applying maximum water levels to each of those sections.
Data from water level gauges stationed along the river as well as the Hydrology Centre’s hydraulic model currently used for flood forecasting were analyzed.
A survey team was also sent out in 2019 to verify peak flood levels and confirm the accuracy of the Hydrology Centre’s modeling. In addition to this, aerial imagery of the 2018 flood was used to validate the extent of flooding.
“We are committed to providing timely and accurate information so that people and organizations can plan and prepare for future floods, protecting their health and safety,” said Environment and Local Government Minister Jeff Carr. “The more accurate and update-to-date information we have, the better positioned we are to make informed decisions quickly.”
A similar methodology was used to update the 2008 map to more accurately reflect historical flooding. The map focused on the area from Mactaquac to the Bay of Fundy where flooding was the worst.
The new maps do not account for future potential flooding that may result as the climate changes. They also do not reflect the risk associated with one-in-20-year flooding or one-in-100-year flooding frequencies. Separate flood hazard maps are being developed under the Climate Change Action Plan and work on this initiative is ongoing.