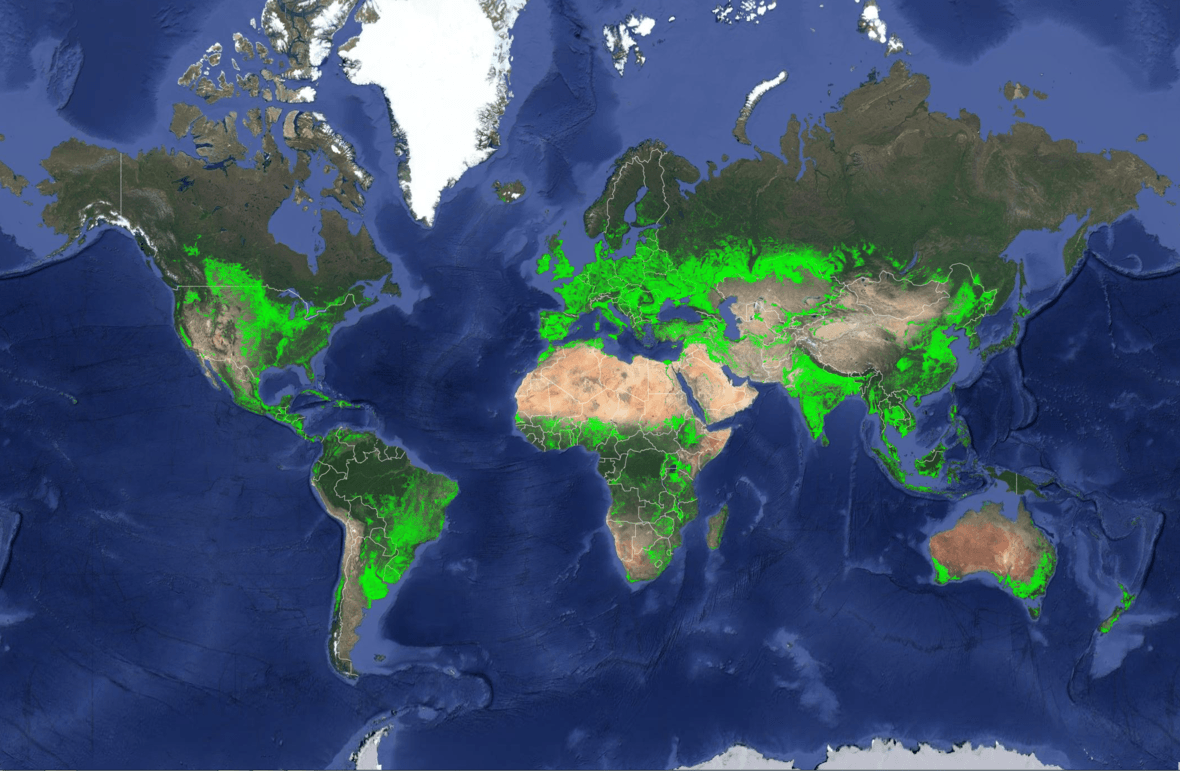
A new interactive map released this week provides the highest resolution of agriculture croplands worldwide ever published. The study has the potential to be a powerful tool for decision-makers to support global food and water security.
Led by the USGS, the work is part of the Global Food Security-Support Analysis Data @ 30-m (GFSAD30) Project, built primarily from Landsat satellite imagery with 30-meter resolution. It shows that there are 1.87 billion hectares of croplands in the world, which is 15 to 20 per cent higher than former assessments.
Earlier studies have suggested that either China or the United States have the highest net cropland area, but the data shows that India ranks first, with 179.8 Mha (9.6 per cent of the global net cropland area). Second is the United States with 167.8 Mha (8.9 per cent), China with 165.2 Mha (8.8 per cent) and Russia with 155.8 Mha (8.3 per cent).
The map shows that Canada possesses 2.29 per cent of total global cropland, representing 4.7 per cent of Canada’s land mass. Statistics of every country in the world can be viewed in an interactive map.

Importance of monitoring croplands in great detail
While the research did not put Canada at the top of the list for agricultural markets, studies projecting future agricultural yields, such as those conducted by the Food and Agriculture Organization (FAO), have noted that Canada is ranked number one in global production of lentils, peas, linseed, and rapeseed (canola), and second in oats and blueberries by the United Nations.
“The Landsat global cropland extent map is crucial for accurately assessing global water and food security assessments based on big data and novel methods,” said Prasad Thenkabail, USGS research geographer and principal investigator for the GFSAD30 Project Team. “This should be helpful for better understanding Canada’s agricultural production, consumption, and exports,” he said.
“The map clearly shows individual farm fields, big or small, at any location in the world. Given the high resolution of 30 meters and 0.09 hectares per pixel, a big advantage is the ability to see croplands in any country and sub-national regions, including states, provinces, districts, counties, and villages.”
With the global population nearing the 7.6 billion mark and expected to reach 10 billion by 2050, it is of increasing importance to understand and monitor the state of agriculture across the world in great detail.

“This map is a baseline and starting point for higher level assessments, such as identifying which crops are present and where, when they grow, their productivity, if lands are left fallow and whether the water source is irrigated or rain fed,” said Thenkabail.
Critical for assessing water security
The map is also critical as a baseline for assessing water security. Nearly 80 per cent of all human water use across the world goes towards producing food, and this research provides insight on “crop per drop,” which is an assessment of the amount of crops produced per unit of water. Agriculture currently accounts for a small proportion of Canada’s overall water use, which refer to any utilization of water regardless of whether it is consumed or returned to its original source. However, agricultural consumption of water, water withdrawn but not directly returned to its original source, is substantial compared to other economic sectors. Statistics reported by Agriculture and Agri-Food Canada for 2009 show that agriculture consumed around two billion cubic meters, or 84 per cent of its water use. Agricultural production can also lead to significant water quality challenges, as exhibited in Lake Erie, Lake Winnipeg, and many other surface water bodies across Canada.
Research is a major undertaking
Thenkabail said that,“one major challenge was obtaining cloud-free images in regions such as the tropics and during rainy seasons. That took multiple years in some areas. This project required the use of satellite-acquired big-data analytics using machine learning algorithms on a cloud computing platform such as the Google Earth Engine.”
Another important aspect of this project was the rigorous validation of the map, leading to an overall accuracy of 92 per cent. Validation was performed by an independent team for 72 zones across the world.
View how croplands are distributed in each of the countries and download data through the Land Processes Distributed Active Archive Center.
The GFSAD30 Project Team’s goal is to map global croplands and their attributes routinely, rapidly, consistently and accurately year after year. The project is a collaborative effort among the USGS, National Aeronautics and Space Administration, Bay Area Environmental Research Institute, University of New Hampshire, California State University Monterey Bay, University of Wisconsin, Northern Arizona University, International Crops Research Institute for the Semi-Arid Tropics, U.S. Department of Agriculture, U.S. Environmental Protection Agency, Environmental Systems Research Institute of Indonesia and Google. The project is funded by NASA’s Making Earth System Data Records for Use in Research Environments Program, with supplemental funding from the USGS.