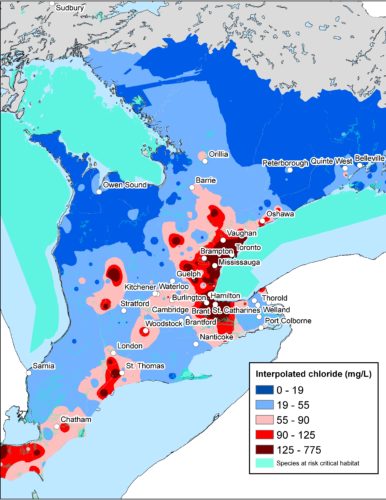
Southern Ontario waterways are showing dangerously increasing road salt levels in WWF-Canada’s Great Lakes Chloride Summer Hot Spot Maps.
“While healthy levels for aquatic life should be less than 120 mg/L, our maps show some areas in southern Ontario currently have levels greater than 1000 mg/L year-round,” said Elizabeth Hendriks, vice-president of freshwater at WWF-Canada. “Ontario is over salting its parking lots, sidewalks, and roadways. A small pill bottle or salt shaker is all that’s needed to melt the equivalent of a city sidewalk slab.”
More than 7 million tonnes of road salt are used in Canada each winter by public road agencies alone. Road salt use by the private sector and small towns is not currently tracked or controlled in Ontario.
Although road salt – sodium chloride, calcium chloride, and magnesium chloride – keeps public areas safe during icy winters, it is a critical threat to the health of Ontario’s freshwater and wildlife year-round.
The runoff from winter applications is affecting the creek and river habitats for species like fish, frogs, and mussels – where these chloride levels endanger their survival during spawning season in the spring and summer months.
Policy Recommendations
WWF-Canada’s chloride map will help inform policy recommendations to the Ontario government. These include:
- Establishing a Provincial Water Quality Objective (PWQO) to address species-at-risk susceptible to chloride levels.
- Regulating road salt application, including mandated training and certification.
- Developing liability benefits for public and private holders that track and record evidence for maintaining public safety and environmental health.
Data Collection
The maps developed by WWF-Canada show chloride levels in Southern Ontario. The first is data collected from 2007-2011, and the second shows data from 2012-2016.
The Summer Hot Spot maps is based on data collected during the summer months (May to October) and allows users to compare chloride levels from 2007-2011 and 2012-2016. Researchers can also look up specific addresses to learn about threat levels in nearby bodies of water using the public maps: https://bit.ly/2Rs0D5Y