The Ontario Society of Professional Engineers (OSPE), the Residential & Civil Construction Alliance of Ontario (RCCAO), and the Ontario Sewer & Watermain Construction Association (OSWCA) have released a joint report entitled Weathering the Storms: Municipalities Plead for Stormwater Infrastructure Funding. The organizations partnered to better assess the province’s ability to manage the impending impacts of climate change and severe weather.
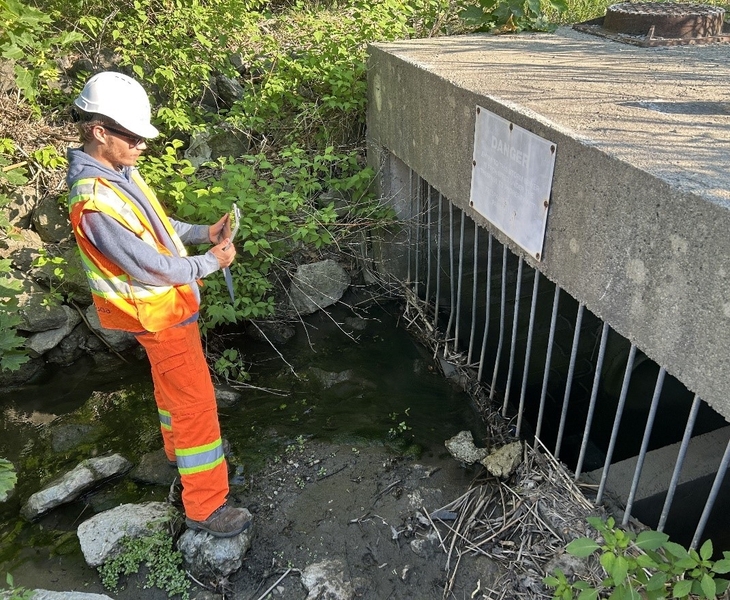
“Stormwater infrastructure is extremely complicated and is significantly different from water and wastewater,” said Mark Hartley, P.Eng., water resources engineer and member of OSPE’s stormwater project team. “Municipalities need to prepare stand-alone Stormwater Infrastructure Asset Management Plans that include details of both engineered and natural structures, including their replacement as well as operational and maintenance costs.
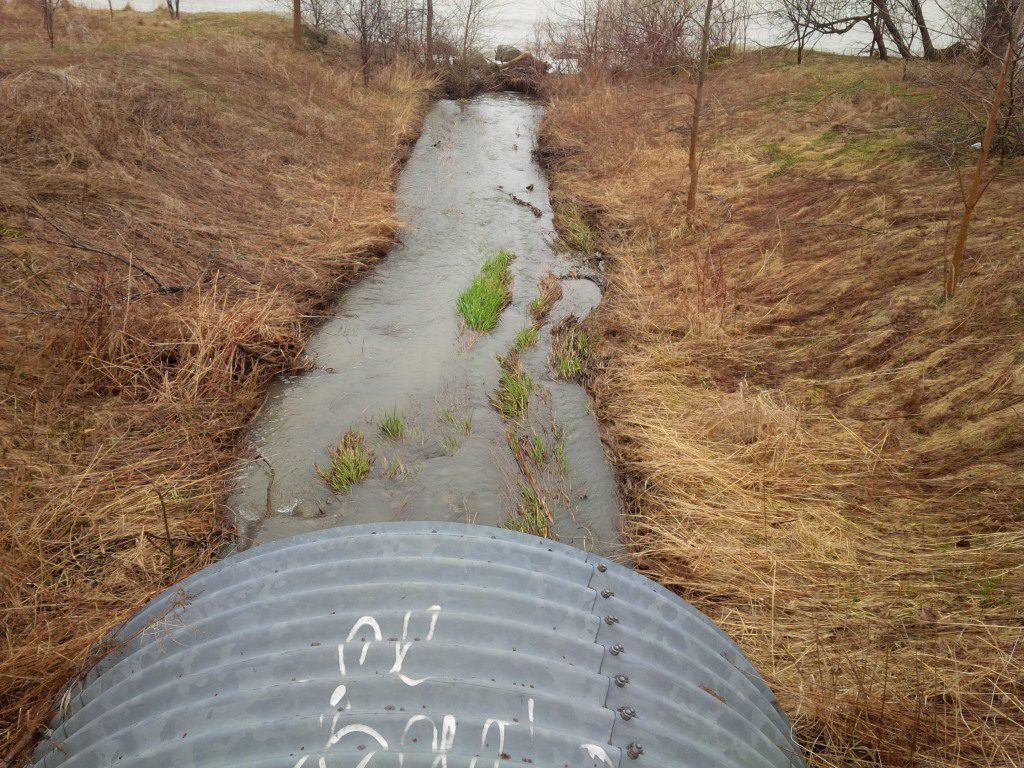
More than half of the municipalities that responded to the survey (58 per cent) reported limited to no engineered stormwater management infrastructure. This is of particular concern when considering the potential dangers that climate change and severe weather patterns pose to our communities.”
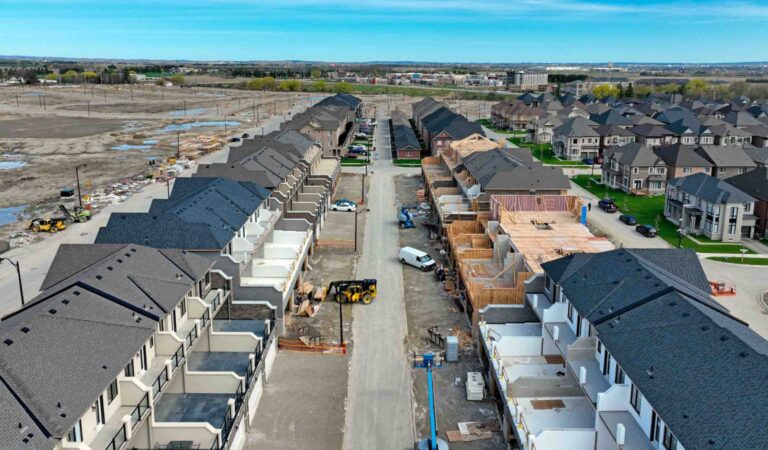
It is estimated that $1.2 billion would be needed to replace stormwater infrastructure in six focus municipalities alone, with populations ranging from under 50,000 to more than 500,000. As this funding gap increases across Ontario, so will the economic and environmental impacts caused by deficient stormwater management systems.
OSPE, RCCAO and, OSWCA believe that this matter must be addressed on an urgent basis to protect property and public health and safety.
Click here to read a copy of the report.
Note: A previous version of this article indicated that the organizations involved were motivated to advocate for stormwater infrastructure due to changing weather patterns. This is not the case. See Robert Muir’s comments below.




Correction on ‘era of more intense weather’: Engineering Climate Datasets (version 2.3) – the data engineers use for drainage design, generated by Environment and Climate Change Canada – shows no overall increase in Ontario. Data for southern Ontario (particularly trend direction and statistical significance data as part of the most recent datasets) shows twice as many statistically significant DECEASING annual maximum rainfall observations as increasing ones. And for short durations (those responsible for flashy runoff in urbanized catchments) there are no statistically significant increases in southern Ontario. Here is a full review:
https://www.slideshare.net/RobertMuir3/storm-intensity-not-increasing-factual-review-of-engineering-datasets
The statements by the insurance industry (which does not understand hydrology and gravitates to meteorology for a plausible explanation of flood damages) that storms are more more severe or frequent have been shown to be unsupported, in fact confusing predictions with past observations. False statements have been corrected by several insurers as a result of Advertising Standards Canada complaints.
Infrastructure upgrades are certainly needed to improve the level of service and mitigate flood damages, but the drivers are largely hydrologic and hydraulic and not meteorologic. This is a review of the quantifiable hydrologic factors:
http://www.cityfloodmap.com/2016/08/urbanization-and-runoff-explain.html
Media has a short attention span regarding flooding, often claiming events that are unprecedented and extreme when in fact they are not. Good examples in the Toronto area include the GO Train flood of July 8, 2013. The operator said it was unprecedented but in fact there was a larger flood 6 weeks earlier on May 28 that missed the trains due to timing/schedule:
http://www.cityfloodmap.com/2015/12/stranded-metrolinx-go-train-avoidable.html
So an operational issues was mischaracterized as an extreme event when in fact the Don River flood flow was less than a 5-year return period when the train and 1400 passengers were stranded. How long has the GO Train Richmond Hill line been flood prone? Ever since it started in the late 1980’s – here is a picture from 1981 of the same train line service stranded at the exact same spot:
http://www.cityfloodmap.com/2017/05/go-train-flooded-in-1981-too-media.html
Yes, exact same spot in 1981, and larger flood in May 2013.
Lake Ontario levels are also being reported as being off the charts due to climate change when in fact the 2017 spring levels (while above average) are only centimetres above previous maximum monthly levels:
http://www.cityfloodmap.com/2017/05/lake-ontario-water-levels-above-maximum.html
So the media, and engineers, have to do a better job of characterizing trends and calling out non-extremes. There is a need for stormwater infrastructure spending but it largely relates to adapting older design standards to current needs and expectations and not responding to conditions that we have not seen before:
http://www.cityfloodmap.com/2016/04/design-standard-adaptation-vs-climate.html
Do review the paper by Environment and Climate Change Canada scientists published in Atmosphere-Ocean in 2014 for a discussion of where there are regional decreasing trends in extreme rainfall (St Lawrence basin and Maritimes) and places with increases (not Ontario).
Environment Canada has been correcting false reporting by the insurance industry on this topic of increasing rainfall, for example correcting CBC reporting:
http://www.cbc.ca/news/canada/windsor/more-than-half-of-homeowners-insurance-claims-stem-from-water-damage-broker-says-1.3291111
Or recent reporting in Canadian Underwriter:
http://www.canadianunderwriter.ca/insurance/new-ibc-flood-model-shows-1-8-million-canadian-households-at-very-high-risk-1004006457/
In the article above Environment Canada corrects that statement of the insurance industry that 40 year storms are happening every 6 years and Canadian Underwriter Associate Editor adds:
“Associate Editor’s Note: In the 2012 report Telling the Weather Story, commissioned to the Institute for Catastrophic Loss Reduction by the Insurance Bureau of Canada, Professor Gordon McBean writes: “Weather events that used to happen once every 40 years are now happening once every six years in some regions in the country.” A footnote cites “Environment Canada: Intensity-Duration-Frequency Tables and Graphs.” However, a spokesperson for Environment and Climate Change Canada told Canadian Underwriter that ECCC’s studies “have not shown evidence to support” this statement.”
We need evidence-based analysis and reporting to arrive at the most effective solutions to today’s complex infrastructure challenges. The article should be corrected to clarify that only in some regions of the country is there more intense weather – in others it is less intense and municipalities have to focus on other drivers (hydrology etc.).
Hi Robert!
Thanks for engaging so thoroughly. We wholeheartedly agree that it’s important to be clearly communicate the data.
Best Regards,
WC team
.. correction to my past comment “How long has the GO Train Richmond Hill line been flood prone? Ever since it started in the late 1980′s ”
.. meant to say since the “late 1970’s” not 80’s.
.. correction to my past comment “How long has the GO Train Richmond Hill line been flood prone? Ever since it started in the late 1980′s ”
.. meant to say since the “late 1970’s” not 80’s.