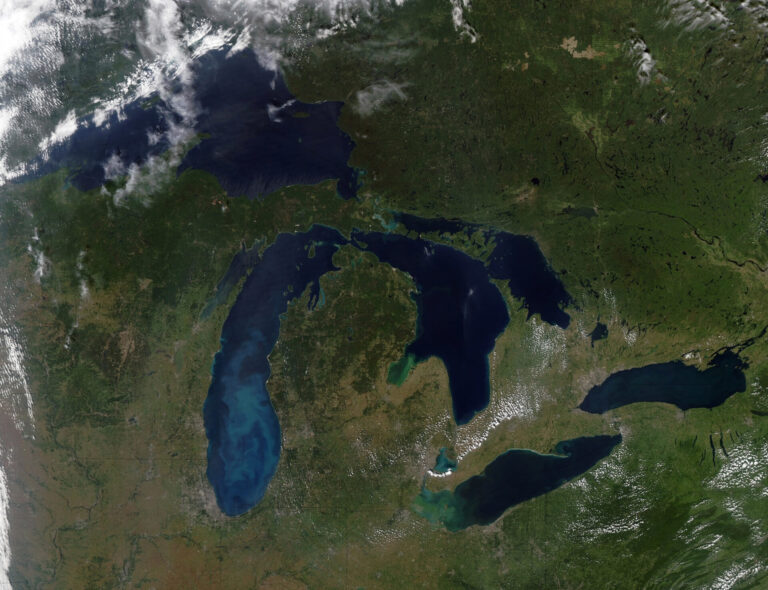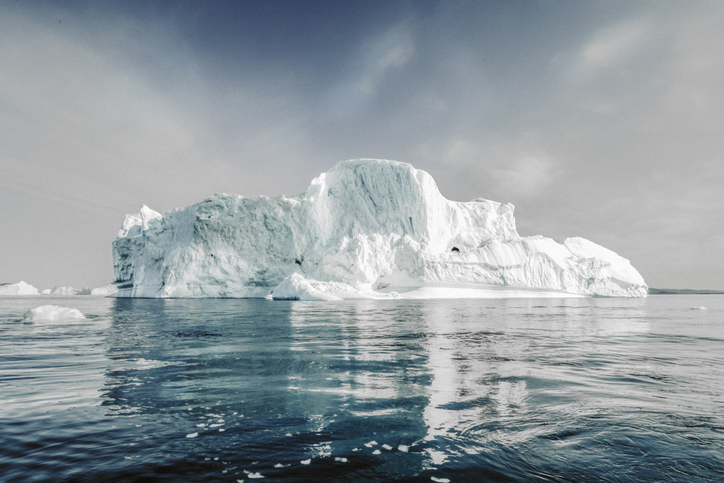
Canada’s water resources scientists and engineers generally agree that climate change will have an impact on our water; however, we have not incorporated climate change assessments into many of our water management efforts. Will the water levels in the Great Lakes decline? Will the rivers of the Prairies overflow their banks more often and will they sustain our needs in the summer? How long will the glaciers of the Rockies continue to support icy rivers? While the state of climate change science and modelling technology has not advanced sufficiently to make singular and reliable predictions, it is practical and prudent for our industry to use available resources and tools to evaluate the expected range of climate change impacts.
Water resource managers are recognizing the need to develop adaptation and mitigation strategies to guard against anticipated changes at the local scale. To that end, the Ontario Ministry of Natural Resources and Ministry of the Environment sponsored the development of the Guide for Assessment of Hydrologic Effects of Climate Change in Ontario, produced by EBNFLO and AquaResource Inc. in 2010.
Michael Garraway is the water budget coordinator with the Ontario Ministry of Natural Resources. According to Garraway, the Province recognizes that a thorough understanding of the potential impacts of climate change on hydrology is important to develop climate change adaptation strategies. “To our knowledge, the Guide is the first of its kind developed and is equally relevant for all Canadian water resource managers, planners and practitioners,” he says.
As described in the Guide, water resource practitioners have two broad considerations when setting out to project climate change impacts: they need to develop or obtain future climate datasets, and they need to select a modelling or assessment approach that suitably represents the hydrologic processes that may be influenced by a changing climate.
Global climate models
The primary tool used to estimate future climate are global climate models (GCMs). GCMs are complex physically based three-dimensional models that represent the earth’s atmosphere, oceans, and land surfaces and simulate, over several decades, the interactions of processes that determine weather and climate. Numerous modelling centres around the world have developed GCMs that are used for long-term (250-year) simulations to characterize the evolution of temperature, precipitation, solar radiation, winds, and other parameters well into the future.
GCMs produce global scale output at relatively coarse grid point spacings of 250 to 400 kilometres. Simulations are designed to characterize future climate on an annual, seasonal, and monthly basis. At present, there are more than 60 future climate simulations available from the collaborative research of the members of the Intergovernmental Panel on Climate Change (IPCC).
This large set of simulations is the result of applying more than 20 GCMs to four greenhouse gas (GHG) emission scenarios. The four emission scenarios have been developed by the IPCC and reflect atmospheric levels of GHGs under four storylines, each representing a different future trend in terms of global economy, demographics, governance, technology, and GHG emission levels. While the IPCC considers each of these outcomes equally plausible, the climate outcomes differ significantly in terms of annual and monthly temperature and precipitation change from existing conditions at all model grid points. This disparity is illustrated in Figure 1 and is due to differences in the GCMs and the emission scenarios.
Downscaling simulations
When projecting possible hydrologic impacts from climate change, water resource practitioners are faced with the challenge of developing or obtaining climate datasets that reflect the temporal and spatial level of detail needed at the local scale. GCMs lack the local scale parameterization and feedback from locally significant features (i.e., topography and surface water) to reflect local scale climate directly in model output.
Research institutions continue to develop various methods of downscaling GCM simulations. They include statistical downscaling, weather generators, and regional climate models. The most established methodology for estimating future local climates uses the GCM simulations to estimate annual, seasonal, or monthly changes for each climate variable for a future time period relative to a baseline climate period. These relative changes, called change fields, are used to adjust the observed climate station data time series to reflect future conditions. This approach results in an altered input climate time series that reflects the average relative change in each parameter and, through the use of local observations, the local climate. The change field method is a simple approach to develop future local climates that reflect large scale average features and allows the use of all GCM and GHG emission scenarios.
The percentile method
The IPCC recommends that water resource practitioners use as many future climate simulations as possible when conducting a climate change impact assessment. However, in most assessments it is impractical to conduct an evaluation with the full set of over 60 future climate simulations. The Guide describes a method, referred to as the percentile method, for selecting a smaller subset of climate scenarios from the full list that is statistically representative of the full set.
Figure 1 illustrates a scatter plot of GCM simulated annual mean change in temperature and precipitation for the period of 2041 to 2070 for 57 scenarios at a climate station in southern Ontario. This figure displays the significant level of disparity among GCM models and emission scenarios as mean annual temperatures range from +1.7 Celsius to +4.9 Celsius , while annual precipitation changes range from -6 per cent to +17 per cent. The percentile method selects 10 scenarios from this set. Five scenarios are selected based upon the simulated changes in temperature and five are selected based upon changes in precipitation. For both parameters, scenarios are selected that best represent the 5th, 25th, 50th, 75th and 95th percentiles. This subset represents the groups mean, variability and extremes.

An Ontario case study
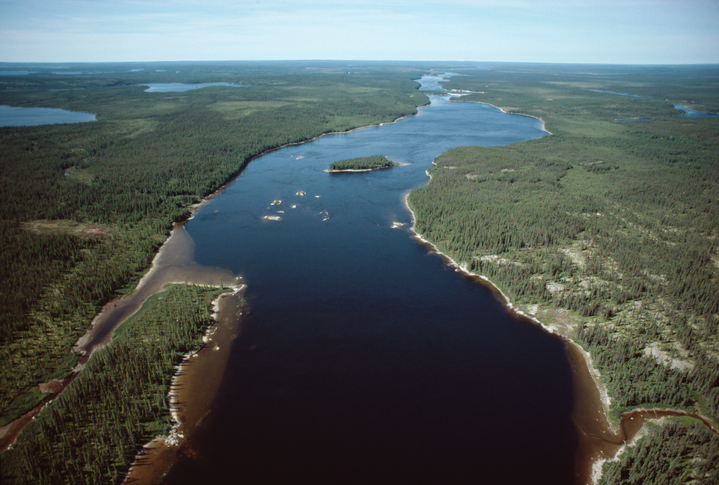
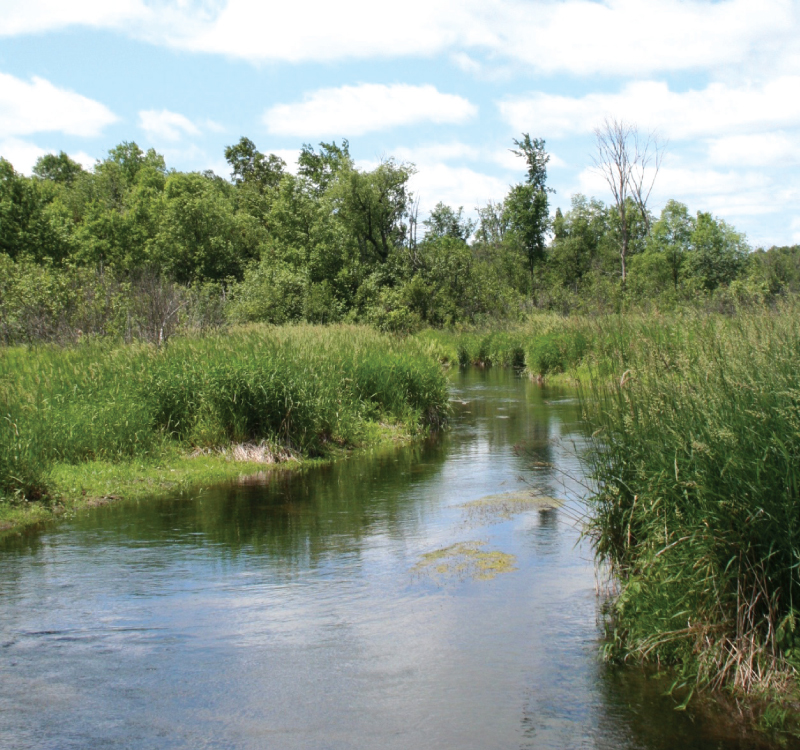
The Guide provides a case study demonstrating the application of the percentile method and change field approach to project the impact of climate change on the headwaters of the Credit River (Figure 2), near the Town of Orangeville, Ontario. The case study includes the application of a continuous streamflow generation model (HSP-F) and groundwater flow model (MODFLOW) to estimate the hydrologic effects of a series of future climate scenarios.

The water resource quantity issues associated with the study area and the headwaters of the Credit River include the following:
• Future availability and reliability of municipal groundwater supplies;
• Baseflow/low flow concerns from a fisheries and wastewater assimilation perspective; and,
• High flow and peak flow concerns from a flood risk and instream erosion perspective.
The hydrology of the study area is relatively complex. In addition to natural processes and sources of water in the system there are several human influences with significant consequences. These influences include groundwater pumping for municipal supply, wastewater discharges into the Credit River, storage in a lake with controlled outflow and the many incremental effects of agricultural development, aggregate extraction, and urbanization. To assess potential climate change impacts to streamflow and the water budget, the following tasks were completed as set forth in the Guide:
- Selection of future climate datasets. The selected climate change datasets included nine GCM scenarios selected using the percentiles method as well as the baseline scenario.
- Development and calibration of a physically based hydrologic model. Simulated parameters included streamflow and water budget parameters (precipitation, runoff, recharge, and evapotranspiration)
- Development and calibration of a physically based MODFLOW. The groundwater flow model utilized monthly groundwater recharge rates as simulated by the hydrologic model.
- Simulation of climate change Impact scenarios. The hydrologic and hydrogeologic models were used to simulate current conditions (1961 to 1990) and nine separate future climate datasets for 2041 to 2070.
- Evaluation of results.
The model simulations provide predictions of runoff, evapotranspiration, streamflow, groundwater discharge, and water levels on an hourly or daily basis over a 30-year period. To evaluate changes in streamflow, it is necessary to summarize long term hydrographs into statistical metric(s). Examples of such statistical metrics are mean annual and monthly flow, median monthly flow, maximum daily streamflow, and low flows statistics, such as 7Q streamflow.
When assessing the impacts of climate change, understanding the distribution of streamflow throughout a particular year is critical for a variety of water management aspects, including peak and low flow management, and fisheries management. For this reason, changes to monthly streamflow must also be investigated.
Average monthly simulated streamflow for the baseline climate and the nine future climates are shown in Figure 3. All nine future climates have streamflow distributions that follow a similar trend wherein flows peak in early spring, decline to annual lows through the summer and rise through the fall and early winter. However, the timing of the decline in flow from the spring to the summer is shifted to earlier in the year. This seasonal shift is due to warmer air temperatures which lead to an earlier spring snowmelt. In addition, the majority of future climates will cause winter streamflow to experience increases of up to 50 per cent. Increases in winter streamflow are primarily due to winter precipitation occurring predominantly as rainfall, rather than snowfall. Several scenarios estimate that summer low flows will range below current levels due to changes in summer precipitation and higher summer evapotranspiration in the future.

Canadian water resource practitioners are going to be increasingly relied upon to make predictions of the impacts of climate change on our water resources. The Guide for Assessment of Hydrologic Effects of Climate Change in Ontario describes an impact assessment methodology that is suitable across all of Canada. While we cannot make definite predictions of our future climate, the state of climate change and hydrologic science is sufficient for our industry to estimate the likely range of impacts that might be expected across Canada. With this information in hand we can begin to identify potential impacts and suitable mitigation and adaptation measures. WC
Bob Walker is president of EBNLFO Environmental in Waterloo, Ontario and is a specialist in water resources modelling and climate change impacts.
David Van Vliet is vice president of AquaResource Inc., a specialized water resources consulting firm located in Waterloo, Ontario.