Traditional users of the land have a wealth of information about that land. In the past, traditional knowledge (TK) studies have supported land and compensation claims, but the mainstream scientific community often has difficulty using this information. Methodologies can be vague; the studies sometimes report only summaries of the data, and often the actual data is kept locked up by confidentiality agreements. These studies focus on cultural values and beliefs that, while important to the communities, are deemed of little utility to scientific study.
 However, a well-designed TK study has the potential to collect significant baseline information that can benefit everyone—even scientists. If we ask the right questions, we may find answers that we can get in no other way.
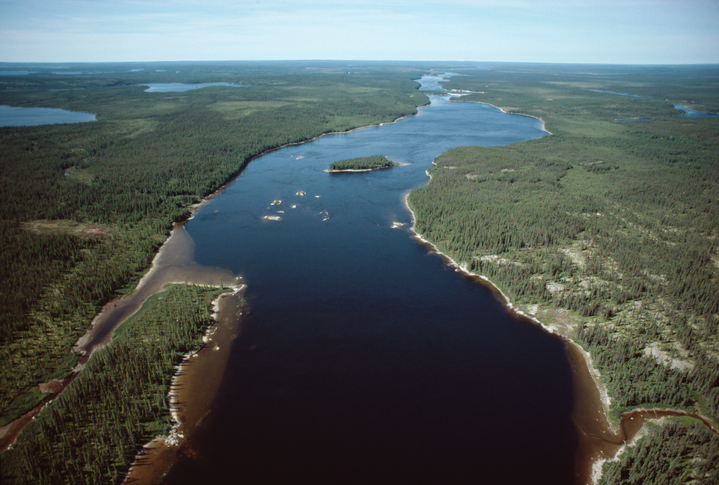
In 2011, the Cumulative Environmental Management Association (CEMA) began looking into the state of knowledge about surface water–groundwater (SW-GW) interactions in Alberta’s Lower Athabasca Region (LAR) as part of its mandate to study cumulative environmental effects of the industrial, residential, and forestry related developments in the Rural Municipality of Wood Buffalo (RMWB) and develop recommendations on how best to manage them.
CEMA commissioned Alberta Innovates to study the problem and recommend ways to improve our understanding of SW-GW interactions. These recommendations included several approaches, one of which was a study into the traditional ecological knowledge (TEK) of the First Nations and Métis groups throughout the LAR. In the summer of 2012, CEMA contracted SNC-Lavalin Environment & Water (E&W) to do this work with a goal to identify SW-GW sites known to members of these local groups.
Many First Nations people still spend significant time living on the land pursuing traditional activities such as hunting, trapping, fishing, and plant gathering. Two of CEMA’s working groups (the water working group and the TK working group) combined resources to fund a project to identify people whose experience on the land might provide information about possible interaction sites. Some of these sites might have significance to First Nations people but be unknown to groundwater and surface water researchers.
Translating the science
During the summer, Bernadette Tenning, an aboriginal consultation specialist at E&W, and I developed a questionnaire based on visual indicators of SW-GW interactions. We reviewed the published science on what identifies a SW-GW interaction site and interpreted it so that non-scientists could recognize what we were looking for—a complicated task, because there are a number of different kinds of interactions and their surface manifestations are quite different.
We also wanted to gain an understanding of the people we planned to interview. Where were they born? Where did they spend their time? What did they do while they were out in the bush? We wanted to know this for several reasons, but the most important reason was to try to identify locations that might have cultural significance because these sites would be the most in need of monitoring and protection.
From September to November, we interviewed people from the LAR, Fort Chipewyan, Fort McKay, Fort McMurray, Anzac, and Lac La Biche. This study would have been extremely difficult without assistance from the Community Liaison Research Team that is supported by CEMA, which consists of people from the communities who can assist TEK researchers with their work.
What did we ask?
The questions we asked fell into three main sections:
• Biographical questions sought to identify the range of activity of each participant within the study area. When and where were your first and last hunting, fishing, and plant-gathering experiences? Where and when had people camped for more than a week at a time?
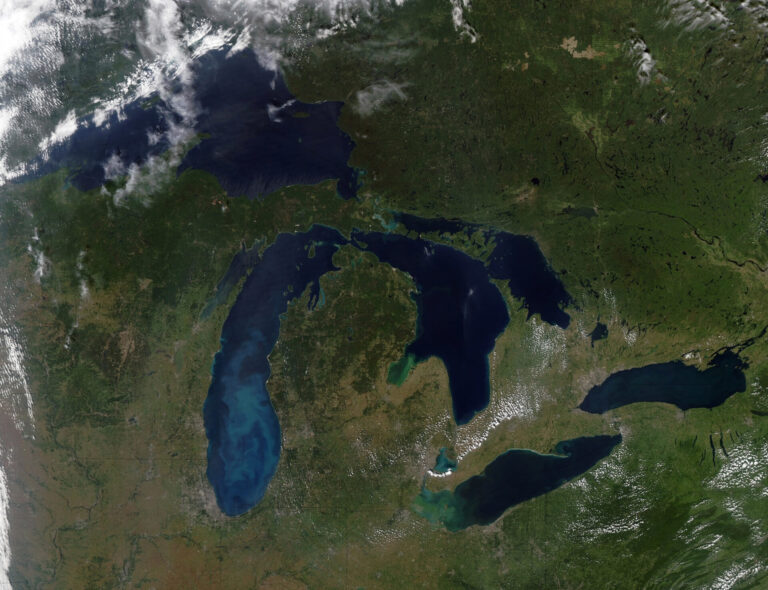
• The second set of questions sought to identify any environmental changes the participants might have observed during their lifetime. We asked about the major water bodies in the region: the Athabasca, the Clearwater, and the Peace. We also asked about observed changes to lakes, muskegs, and creeks. We encouraged participants to define the water bodies they thought were important rather than ones that might be important to us.
• The last group of questions concerned SW-GW interaction sites. We gathered the participants from one group, usually eight people, and discussed the kinds of things we were looking for. We provided pictures of features and described the things that might be seen at each type of interaction. This discussion was invaluable because participants could react and comment on each type of interaction. A comment from one would trigger a memory in another.
After the briefing, we interviewed each participant. The interviews were conducted by one researcher from E&W and a CLRT member.
In TEK studies, this interview and mapping process is called participatory mapping or a map biography. In essence, the process involves spreading out some maps and asking the informant to indicate locations where things occurred. As we worked through the questionnaire, the participants would indicate areas they wished to discuss; we would extract the appropriate map, mark the location on the map with a feature code, and make notes about the code.
Evaluating the results
 Once the interviewers returned from the field, we digitized the field data. The resulting GIS database was the basis for the rest of the study.
Sixty-two people, representing eight First Nations and Métis groups, participated in the interviews. The 13 women and 49 men ranged in age from 19 to 92 with a majority between 57 and 73. Since the study area for this project is 93,212 square kilometres, even 62 participants could not cover it all. Fifty-nine of the map sheets that make up the study area (about 45 per cent) do not contain any data, and in many areas the data is sparse.
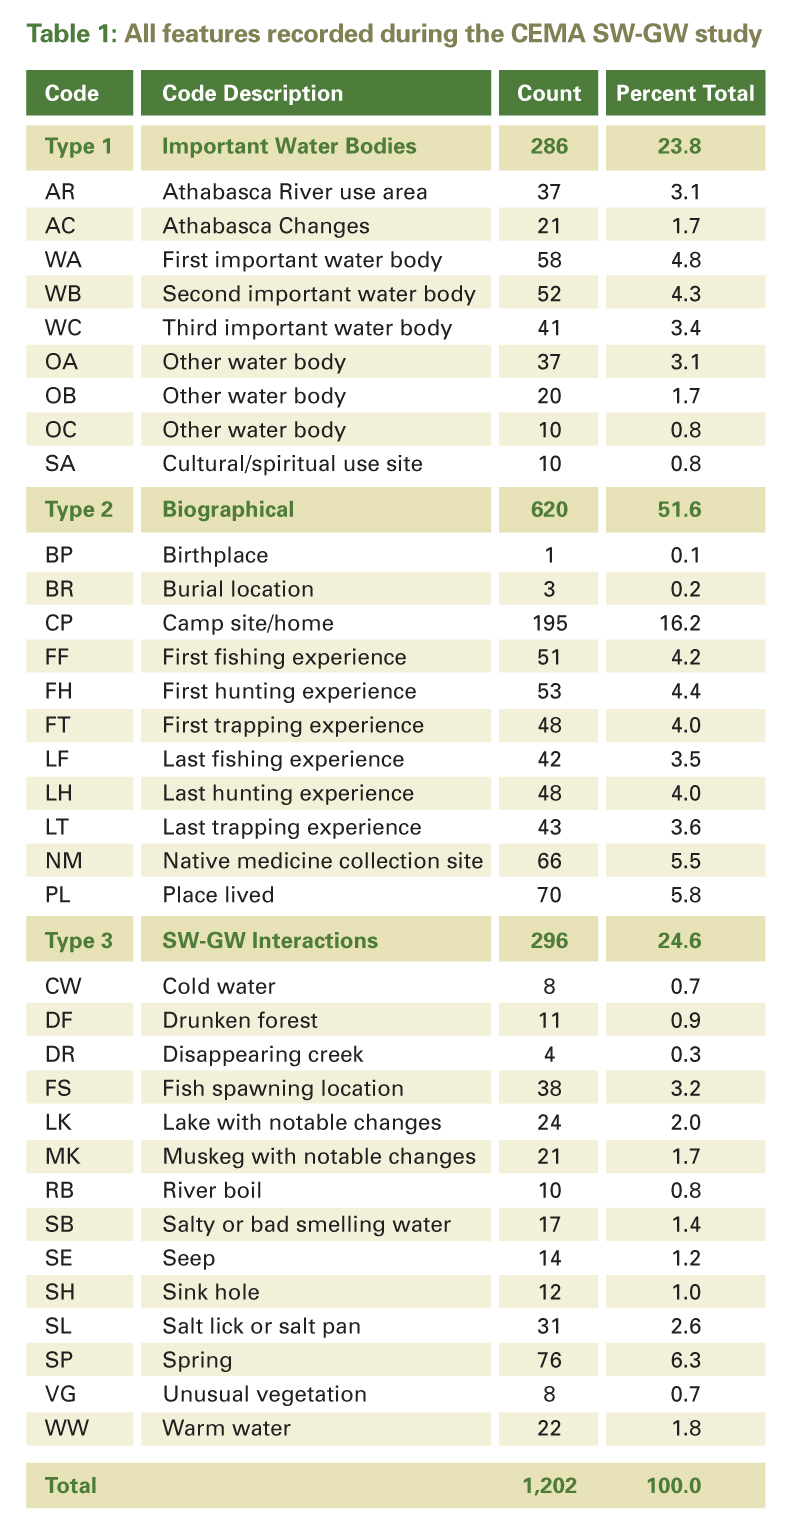
Table 1 presents a summary of the all 1,202 sites recorded during this study. As expected, the number of sites recorded for the environmental and biographical sections were much greater than for the SW-GW interaction sites. Based on nothing more than conjecture, we estimated perhaps 50 or 60 potential interaction sites—we got 296. Our participants understood quite well what we were looking for, but that meant we had some work ahead of us to determine the best potential sites for further research.
First we analyzed the relative numbers of the interaction types. Some types of sites, such as springs, seeps, or lakes and muskegs, relate directly to the daily lives of the participants. Clear spring water is something that is sought after and, if found, the information is shared. Other types of interactions did not appear to play as big a role in the lives of the participants and are less well reported.
We included 14 field indicators of potential SW-GW interactions in the questionnaire (Type 3 in Table 1). During the analysis, we eliminated five from further consideration for reconnaissance. For example, lakes and muskegs were dropped because they are ubiquitous and because their locations are already known through normal mapping techniques.
We eliminated three other feature types—drunken forests, cold water, and unusual vegetation—based on the ambiguous responses. None of the responses to these queries presented a clear indication of a potential SW-GW interaction.
Nine indicators remained, leaving a total of 224 locations. Three factors became priorities for SW-GW interactions:
1) An evaluation of the hydrogeological potential of each feature type. Interaction types we felt were more likely to be present and to provide useful information were rated as 3 and lower potential sites were rated as either 2 or 1.
2) The proximity of a feature to a mapped waterbody. This was an attempt to evaluate the potential for a groundwater source to actually interact with surface water. It is possible that a groundwater source might come to the surface at a distance from any local surface water and evaporate or disperse without significant interactions with surface water. To develop this rating, the SW-GW maps were compared with the National Hydro Network vector digital data using ArcGis 10.0. Two buffers for each SW-GW interaction were chosen: 25 metres and 100 metres. Features within 25 metres were rated as 3, features within 100 metres were rated as 2, and features beyond 100 metres were rated as 1.
3) An estimate of the last time a feature had been observed. The range of dates from the first to last observations was about 60 years, so we divided this range into three segments of 20 years, with the most recent given the rating of 3 and older observations given either a 2 or 1.
To rate site priorities, we added the scores of these three factors (see Table 2). Higher totals became higher priority. None of the features has a priority rating of less than two. Ninety locations are rated as 7, 8, or 9.
In Phase 2 (now underway and continuing into 2014), the team—including the participants—is visiting these 90 sites to evaluate the locations and observe physical indicators, such as water colour, temperature, clarity, odour, aquatic plant species in the vicinity of the site, mineral precipitate, unique sediment zone, and benthic organisms. Characterization will also include descriptive variables such as local terrain, slope, weather conditions, and local vegetation. The team also takes a water sample for analysis. Based on these evaluations, the team is recommending some locations for Phase 3 water monitoring. WC
James Light, M.A., is the senior archaeologist at SNC-Lavalin Environment & Water’s Calgary office. This article appears in Water Canada’s September/October 2013 issue.