Rising water demands are putting increasing pressure on many water agencies’ infrastructure and thus signaling the possible need for greater capital investments. A key ingredient in knowing when these investments will be needed, as well as their scale, is having a good forecast of the likely future trends for water demands. Forecasting water demands can be labour, data, and time intensive—especially for smaller water agencies.
 Compounding the challenge of demand forecasting is the following situation found in many water supply agencies: it’s not uncommon for one division to be responsible for forecasting demand growth and planning infrastructure development while another office is responsible for the design of demand-management strategies. If the two offices don’t communicate, then one office’s successes in managing demands could throw off another office’s long-run demand projects and related investment plans.
This is not an abstract problem. A 2008 American Water Works Association survey indicated that most North American water utilities forecasted water demands by multiplying future population estimates by historical per capita water use. The problem with this approach is that it fails to account for other demand drivers, such as income, prices, and household appliance holdings. Unfortunately, in order to incorporate these demand drivers, a water agency often must gather significant amounts of data and deploy staff to carry out the forecasts. This isn’t always feasible, and the lack of data, resources, and institutional capacity pose important challenges to many smaller water utilities that prevent them from adopting more enhanced demand simulation and forecasting methods.
Researchers at Brock University are working with industry partners to address this issue. Led by water economist Steven Renzetti and funded by the federal government (through the Canadian Water Network and the Water Economics, Policy and Governance Network), the initiative aims to develop a user-friendly, spreadsheet-based demand forecasting and simulation tool that can provide water utilities with the capacity to forecast medium-term demands while simultaneously accounting for planned or expected changes in important demand drivers.
Using price and income elasticities estimated from their own customer data or from preset default values, the forecasting program provides several concrete benefits to water agencies:
1. Develops the capacity to produce more accurate water demand forecasts;
2. Allows agencies to assess likely impacts of pricing and other policy measures through sophisticated planning tools;
3. Provides the capacity to improve integration of capital investment planning and demand growth and to assess benefits of demand-side management measures in terms of the values avoided through deferral of investments; and
4. Helps to engage their stakeholders (such as city councils and members of the public) in discussions regarding the relative merits of alternative conservation measures.
Figure 1 is a screen capture of one of the program’s user interfaces. It demonstrates that the user may input a number of important utility-specific data points, such as average daily consumption, average household income, and the current price schedule. Other interfaces allow the user to set the time horizon for the simulations and the assumed values for price and income elasticities. The user then selects assumed rates of change for water prices, income, climate variables, and other important demand drivers. The program simulates the demand responses and displays the simulated future impacts of the demand drivers on average and total water demands over the time period chosen.
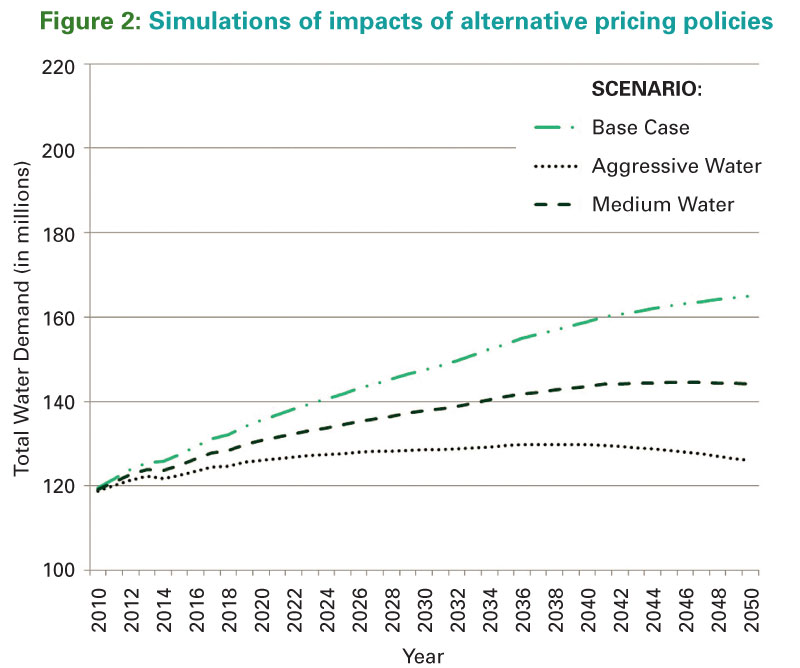
An early version of the model was used in work in partnership with York Region. In that case, population and income  growth were projected to boost water demands and thus put pressure on existing infrastructure. Figure 2 shows the future demand growth scenarios developed under a specific set of assumptions about households’ price and elasticities of demand and several pricing rules. The “base case” continues the recent practice of 0.4-per-cent annual water price increases (adjusted for inflation). The “medium water” and “aggressive water” scenarios show the potential impacts on water demand growth of two- and 3.5-per-cent
annual water price increases (adjusted for inflation). These projected impacts show the potential of pricing policies for curbing demand growth and infrastructure needs, but they, of course, cannot predict the future with certainty.
growth were projected to boost water demands and thus put pressure on existing infrastructure. Figure 2 shows the future demand growth scenarios developed under a specific set of assumptions about households’ price and elasticities of demand and several pricing rules. The “base case” continues the recent practice of 0.4-per-cent annual water price increases (adjusted for inflation). The “medium water” and “aggressive water” scenarios show the potential impacts on water demand growth of two- and 3.5-per-cent
annual water price increases (adjusted for inflation). These projected impacts show the potential of pricing policies for curbing demand growth and infrastructure needs, but they, of course, cannot predict the future with certainty.
This spreadsheet-based model is not designed to replace more sophisticated integrated asset management software. Instead, it is meant to provide smaller water agencies with the capacity to conduct water demand scenario analyses and share the results with its stakeholders. WC
Diane Dupont is a professor in the economics department at Brock University. James Price is a postdoctoral research fellow for the Water, Economics, Policy and Governance Network at Brock University. Steven Renzetti is a professor in the department of economics at Brock University. This article appears in Water Canada’s March/April 2015 issue.